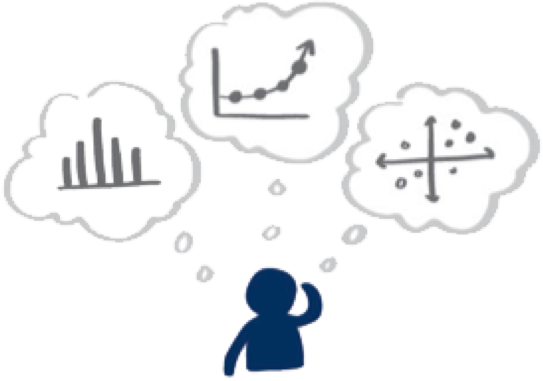
Data visualization is a graphic representation of information. By using visual elements such as charts, graphs, maps, and infographics, researchers provide an accessible way to see and understand trends, outliers, and patterns in their data.
Examples include bar graphs, pie charts, heat maps, scatter plots, posters, etc.
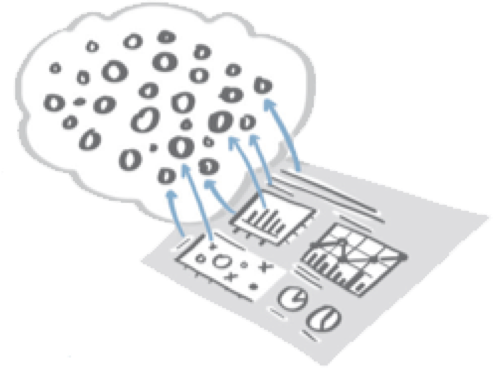
Data, or raw data, is information such as facts and numbers that have been collected together for reference, analysis, calculation, and decision making. Data can be recorded in a variety of formats, from spreadsheets to images, to the written word.
Examples of data would be an excel table of measurements, a collection of survey results, or photographs of sound waves.
Gleason, H. A. (n.d.). Data. Retrieved from https://www.merriam-webster.com/dictionary/data.
Average - a term for the median, mean, or mode of a data; which is often used to describe the most common value.
Bins - consecutive numeric ranges or intervals used in histograms, such as 20-30, 0-100, or 0-2.
Causation - a relationship of cause and effect in which change in one variable always results in change in another variable.
Categoric Information - information that is sorted into groups according to the presence of named characteristics, such as age or nationality.
Correlation - term used when one observes a relationship or connection between two or more elements. A correlation does not indicate that one variable causes another to happen. Positive correlation means the variables increase together, while a negative correlation means that one variable decreases as the other variable increases. Correlation is much more common than causation.
Data point - a single piece of data or information.
Density - the compactness or volume of information associated with a geographic location, variable, or element.
Distribution - the range of values or intervals in a dataset.
Frequency - the number of times a variable, instance, or number appears in a dataset.
Interval - the distance between two numbers.
Key - a text box usually located in the lower right-hand corner of a graph that provides contextual information needed to interpret the graph, such as what specific colors, lines, or shapes represent.
Legend - see key.
Outliers - a value that falls outside the expected range of a dataset and is numerically exceptional in comparison to the other values.
Quartiles - the three values that divide a numeric dataset into four equal parts.
Range - the difference in values from the maximum to the minimum.
Skew - a numeric distribution is considered skewed if, the majority of datapoints fall above or below the median.
X-axis - The horizontal line of a graph where either numbers or categories are listed. Always label your axis.
Variables - a characteristic or object that can be counted.
Y-axis - The vertical line of a graph where either numbers or categories are listed. Always label your axis.
Data is not an argument in and of itself. Just like all primary resources, data requires interpretation to make a point, hence the use of data visualizations. While you are working with your data, really focus on your audience and what you are trying to tell them. Are you trying to convince the general public of a social trend? Do you want to show a company that your marketing team has a better plan for targeting a specific market? Are you trying to convince policymakers to adopt a specific practice to reduce the number of car accidents?
Data visualizations can be powerful, just consider this video on casualties for World War II produced by Fallen.org. Although the video utilizes special effects, the data visualizations are simple ones. The story is told with bar graphs and pictures, yet still manages to elicit an emotional response. While you watch this video, keep in mind the order in which they present information. Where do they pause in the video? How do they introduce new information? What parallels exist in the presentation of the information?
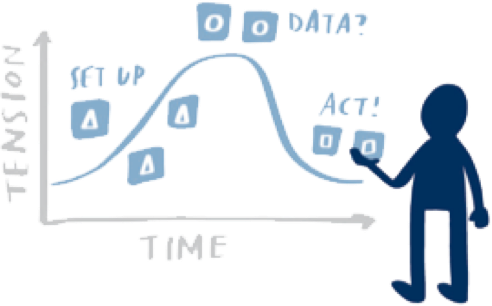
The key to creating a good data visualization is recognizing its context, ie. how you are going to use the visualization to tell a story?
There are 5 steps to telling a story with data: