Skip to Main Content

Data Visualization

This guide will walk you through what data visualization to use based on your research need and data type

Questions that can be answered by Bar Charts and Dot Plots

Bar Chart and Dot Plots can be used to answer the following questions:

x, y = variables

  • Which category has the highest or lowest x?
  • How does x vary across multiple categories?
  • How do multiple categories compare to one another?
  • How do x and y vary across multiple categories? (dot plot)
Steelberg, T. (2017). Data Presentation: Showcasing your data with charts and graphs. In K. Fontichiaro, J. A. Oehrli, & A. Lennex (Eds.), Creating Data Literate Students (pp. 165–192). Michigan Publishing.

Bar Chart

Definition of a bar chart:

A bar chart, or bar graph, presents categoric data with rectangular bars with heights or lengths proportional to the values that they represent. 

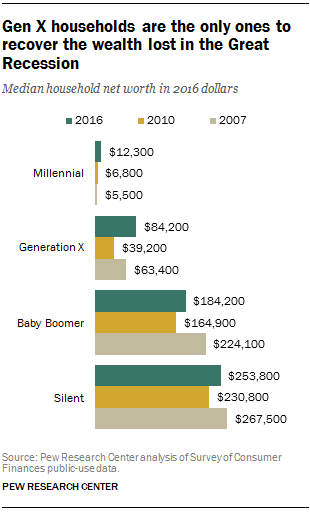
An example of a bar chart would be this bar chart depicting median household net worth in 2016, 2010, and 2007 of different generations. Data from the Pew Research Center: https://www.pewresearch.org/fact-tank/2018/07/23/gen-x-rebounds-as-the-only-generation-to-recover-the-wealth-lost-after-the-housing-crash/

Gen X households are the only ones to recover the wealth lost in the Great Recession

Steelberg, T. (2017). Data Presentation: Showcasing your data with charts and graphs. In K. Fontichiaro, J. A. Oehrli, & A. Lennex (Eds.), Creating Data Literate Students (pp. 165–192). Michigan Publishing.

Tips for Bar Charts

  • Start the y-axis of a bar chart at 0. If you start the y-axis at a different number, be aware that you are misrepresenting the data. If the bar chart is unable to highlight the difference between variables, consider using a dot plot or a line graph.
  • Limit your bar chart to 2 or 3 variables per category or it can get crowded and hard to read. Instead, consider a multi-panel display or separating the information into multiple bar charts for each variable. 
  • Sort your categories in a way that makes them easy to understand, such as ascending or descending in terms of value, so it is easier for comparison. 
  • Try to keep it 2 dimensional. 3D shapes exaggerate size differences and thus make them harder to compare. 
  • Use a bar, not an image or an icon. Images and icons make it difficult to measure the variable to the y-axis, thus making the process of reading the graph more difficult. 
Steelberg, T. (2017). Data Presentation: Showcasing your data with charts and graphs. In K. Fontichiaro, J. A. Oehrli, & A. Lennex (Eds.), Creating Data Literate Students (pp. 165–192). Michigan Publishing.

Dot Plot

Definition of a dot plot:

A dot plot, Cleveland dot plot, or lollipop plot is a variation on the bar graph that allows for the comparison of 2 categoric variables. An example of two categorical variables might be the salary of men and women for the same profession or the size of pockets between men and women's jeans based on brand type. 

An example of a dot plot is this entirely fictional plot found on Python Graphs: https://python-graph-gallery.com/184-lollipop-plot-with-2-groups/

Steelberg, T. (2017). Data Presentation: Showcasing your data with charts and graphs. In K. Fontichiaro, J. A. Oehrli, & A. Lennex (Eds.), Creating Data Literate Students (pp. 165–192). Michigan Publishing.


Tips for Dot Plots

  • Use x-axis and y-axis grids to make comparisons between data easier. Dot plots allow for comparison between significantly more categories, so the grid lines keep the data points from getting confused. 
  • Sort your categories in a way that makes them easy to understand, such as ascending or descending in terms of value, so it is easier for comparison. 
  • Dot plots are not currently a default chart option in basic spreadsheet software, but there are tutorials that lay out the steps to create them. See "Tools" for further information. 
Steelberg, T. (2017). Data Presentation: Showcasing your data with charts and graphs. In K. Fontichiaro, J. A. Oehrli, & A. Lennex (Eds.), Creating Data Literate Students (pp. 165–192). Michigan Publishing.